

A group of 40 students took a test in Economics. The following Venn diagram shows that 19
Question:
A group of 40 students took a test in Economics. The following Venn diagram shows that 19 boys (B) took the test and that seven students failed the test (F).
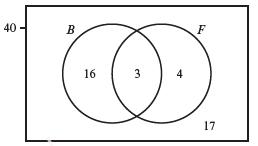
a. Describe the 21 students who are members of the set B'.
b. Find the probability that a randomly selected student is a boy or someone who failed the test.
Fantastic news! We've Found the answer you've been seeking!
Step by Step Answer:
a The set B represents the complement of set B ie the set of students who are not boys To describe t...View the full answer

Answered By
Nikka Ella Clavecillas Udaundo
I have a degree in psychology from Moi University, and I have experience working as a tutor for students in both psychology and other subjects. I am passionate about helping students learn and reach their potential, and I firmly believe that everyone has the ability to succeed if they receive the right support and guidance. I am patient and adaptable, and I will work with each individual student to tailor my teaching methods to their needs and learning style. I am confident in my ability to help students improve their grades and reach their academic goals, and I am excited to work with a new group of students.
0 Reviews
10+ Question Solved
Related Book For 

Cambridge International AS & A Level Mathematics Probability & Statistics 1 Coursebook
ISBN: 9781108407304
1st Edition
Authors: Dean Chalmers, Julian Gilbey
Question Posted:
