

The displacementtime sketch graph in Figure 1.11 represents the journey of a bus. What does the graph
Question:
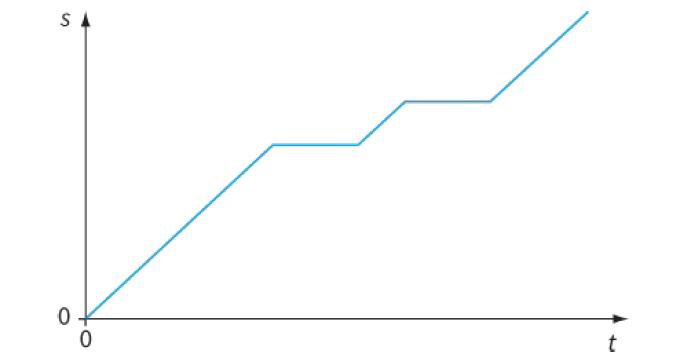
The displacement–time sketch graph in Figure 1.11 represents the journey of a bus. What does the graph tell you about the journey?
Fantastic news! We've Found the answer you've been seeking!
Step by Step Answer:
As per the given graph in the question The slope between the point O to A i...View the full answer

Answered By
Ravindra yadav
I am working as an online educator since the last five years, I started my carrier from toppr.com which is an India's leading education company, where I worked as a content creator, qulaity analyst and online teacher. I also worked with chegg.com as a subject matter expert, online doubt solving and text book solution writer.
0 Reviews
10+ Question Solved
Related Book For 

Cambridge International AS And A Level Physics Coursebook
ISBN: 9781108859035
3rd Edition
Authors: David Sang, Graham Jones, Gurinder Chadha, Richard Woodside
Question Posted:
