

The table shows the numbers of two species, F and G, found in in eight randomly placed
Question:
The table shows the numbers of two species, F and G, found in in eight randomly placed 10 × 10 m quadrats.
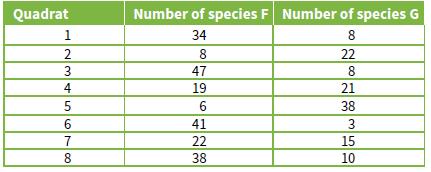
a. Draw a scatter graph of these results.
b. Describe the relationship that is suggested by your scatter graph.
c. Explain why it is better to use Spearman’s rank correlation, rather than Pearson’s linear correlation test, to find out if there is a correlation between the numbers of species F and species G.
d. Use Spearman’s rank correlation to analyse these results. (Note: if two values are equal, then you must give them equal rank.) Show all of your working, and explain what your calculated value indicates.
Fantastic news! We've Found the answer you've been seeking!
Step by Step Answer:
A Below is the scatter plot between F species and G species B According to the scatter plot given ab...View the full answer

Answered By
Harsh khatarkar
I have previously taught students in my hometown. Many of them have gone to national institutes like IITs.
0 Reviews
10+ Question Solved
Related Book For 

Cambridge International AS And A Level Biology
ISBN: 9781107636828
4th Edition
Authors: Mary Jones, Richard Fosbery, Jennifer Gregory, Dennis Taylor
Question Posted:
