

i. Plot the data in Table 22.1 for increase in propene concentration with time. ii. Calculate the
Question:
i. Plot the data in Table 22.1 for increase in propene concentration with time.
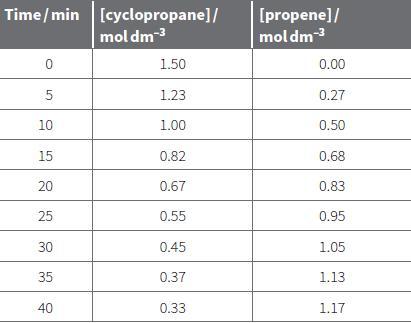
ii. Calculate the rate after 10 minutes (when the propene concentration is 0.50 mol dm–3) by drawing a tangent.
b. Use the same method to calculate the rate of reaction at propene concentrations of 0.00 mol dm–3, 0.30 mol dm–3 and 0.90 mol dm–3.
c. i. Calculate the concentration of cyclopropane when the concentration of propene is 0.00, 0.30, 0.50 and 0.90 mol dm–3.
ii. Plot a graph of rate of reaction against [cyclopropane]. Note that the graph is for cyclopropane concentration NOT [propene] as it is the concentration of the reactant that is affecting the rate not the product.
Fantastic news! We've Found the answer you've been seeking!
Step by Step Answer:

Answered By
Branice Buyengo Ajevi
I have been teaching for the last 5 years which has strengthened my interaction with students of different level.
1+ Reviews
10+ Question Solved
Related Book For 
Cambridge International AS And A Level Chemistry Coursebook
ISBN: 9781316637739
2nd Edition
Authors: Lawrie Ryan, Roger Norris
Question Posted:
