

The rate of reaction between butanone and iodine is studied. In this experiment, iodine is in excess.
Question:
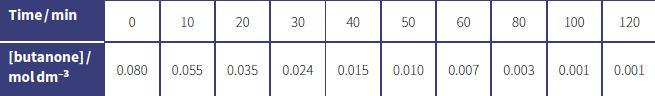
The rate of reaction between butanone and iodine is studied. In this experiment, iodine is in excess. The concentration of butanone is measured at various time intervals. The results are shown in the table below.
a. Plot these data on a suitable graph.
b. Show from your graph that these data are consistent with the reaction being first order with respect to butanone.
c. Find the gradient of your graph when the butanone concentration is:
■ 0.070 mol dm–3
■ 0.040 mol dm–3
■ 0.010 mol dm–3
d. Use your answers to part c to plot a suitable graph to show rate of reaction (on the vertical axis) against concentration (on the horizontal axis).
e. Explain how the graph you plotted in part d is consistent with the reaction being first order with respect to butanone.
Step by Step Answer:
a To plot these data on a suitable graph you can create a graph with time on the xaxis and concentra...View the full answer


Cambridge International AS And A Level Chemistry Coursebook
ISBN: 9781316637739
2nd Edition
Authors: Lawrie Ryan, Roger Norris
