

Examine the following figure and fill in the information below. a. The grape sugar level starts at
Question:
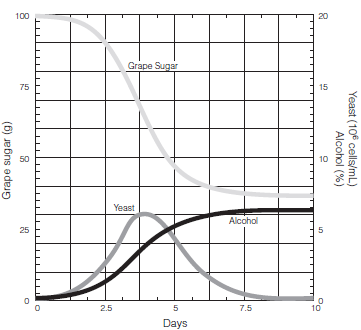
a. The grape sugar level starts at g and ends at g.
b. The yeast population reaches its highest level of approximately on Day .
c. The alcohol level starts at % and ends at approximately %.
d. Look at the graphs showing the correlation between yeast population and percentage alcohol. At what percentage alcohol does this yeast population begin to decline? %.
Fantastic news! We've Found the answer you've been seeking!
Step by Step Answer:
a 100 g appr...View the full answer

Answered By
ANDREW KIPRUTO
Academic Writing Expert
I have over 7 years of research and application experience. I am trained and licensed to provide expertise in IT information, computer sciences related topics and other units like chemistry, Business, law, biology, biochemistry, and genetics. I'm a network and IT admin with +8 years of experience in all kind of environments.
I can help you in the following areas:
Networking
- Ethernet, Wireless Airmax and 802.11, fiber networks on GPON/GEPON and WDM
- Protocols and IP Services: VLANs, LACP, ACLs, VPNs, OSPF, BGP, RADIUS, PPPoE, DNS, Proxies, SNMP
- Vendors: MikroTik, Ubiquiti, Cisco, Juniper, HP, Dell, DrayTek, SMC, Zyxel, Furukawa Electric, and many more
- Monitoring Systems: PRTG, Zabbix, Whatsup Gold, TheDude, RRDtoo
Always available for new projects! Contact me for any inquiries
1+ Reviews
10+ Question Solved
Related Book For 
Campbell Biology
ISBN: 978-0321775658
10th edition
Authors: Jane B. Reece, Lisa A. Urry, Michael L. Cain, Steven A. Wasserman, Peter V. Minorsky, Robert B. Jackson
Question Posted:
