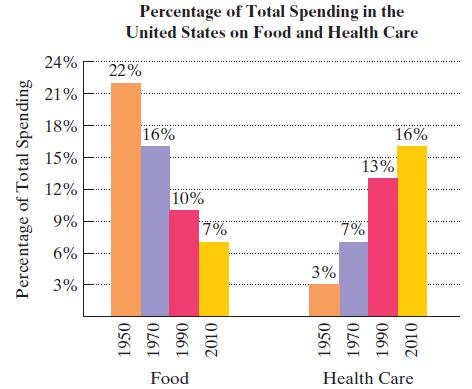
The bar graph shows that as costs changed over the decades, Americans devoted less of their budget
Question:
The bar graph shows that as costs changed over the decades, Americans devoted less of their budget to groceries and more to health care.
 In Exercises 25–26, find a linear function in slope-intercept form that models the given description. Each function should model the percentage of total spending, p(x), by Americans x years after 1950.
In 1950, Americans spent 22% of their budget on food. This has decreased at an average rate of approximately 0.25% per year since then.
Fantastic news! We've Found the answer you've been seeking!
Step by Step Answer:
Related Book For 

Question Posted:


