

The bar graph shows the population of the United States, in millions, for seven selected years. Here
Question:
The bar graph shows the population of the United States, in millions, for seven selected years.  Here are two functions that model the data:
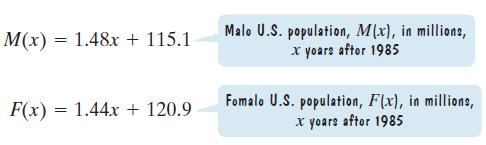 Use the functions to solve Exercises 97–98.
a. Write a function that models the total U.S. population for the years shown in the bar graph.b. Use the function from part (a) to find the total U.S. population in 2010.c. How well does the result in part (b) model the actual total U.S. population in 2010 shown by the bar graph?
Fantastic news! We've Found the answer you've been seeking!
Step by Step Answer:
a b c It is ...View the full answer

Answered By
Mustafa olang
Please accept my enthusiastic application to solutionInn. I would love the opportunity to be a hardworking, passionate member of your tutoring program. As soon as I read the description of the program, I knew I was a well-qualified candidate for the position.
I have extensive tutoring experience in a variety of fields. I have tutored in English as well as Calculus. I have helped students learn to analyze literature, write essays, understand historical events, and graph parabolas. Your program requires that tutors be able to assist students in multiple subjects, and my experience would allow me to do just that.
You also state in your job posting that you require tutors that can work with students of all ages. As a summer camp counselor, I have experience working with preschool and kindergarten-age students. I have also tutored middle school students in reading, as well as college and high school students. Through these tutoring and counseling positions, I have learned how to best teach each age group. For example, I created songs to teach my three-year-old campers the camp rules, but I gave my college student daily quizzes to help her prepare for exams.
I am passionate about helping students improve in all academic subjects. I still remember my excitement when my calculus student received her first “A” on a quiz! I am confident that my passion and experience are the qualities you are looking for at solutionInn. Thank you so much for your time and consideration.
2+ Reviews
10+ Question Solved
Related Book For 

Question Posted:
