

The bar graph shows the ratings of American Idol from season 1 (2002) through season 12 (2013).
Question:
The bar graph shows the ratings of American Idol from season 1 (2002) through season 12 (2013).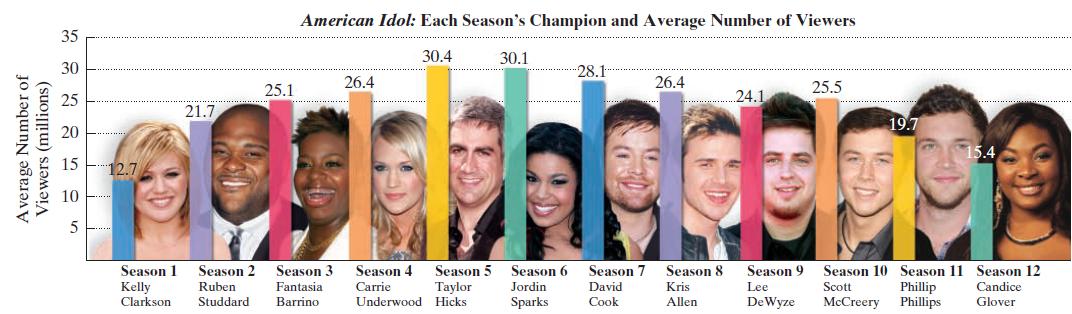 a. Let x represent American Idol’s season number and let y represent the average number of viewers, in millions. Use a graphing utility to draw a scatter plot of the data. Explain why a quadratic function is appropriate for modeling these data.b. Use the quadratic regression feature to find the quadratic function that best fits the data. Round all numbers to two decimal places.c. Use the model in part (b) to determine the season in which American Idol had the greatest number of viewers. Round to the nearest whole number. According to the model, how many millions of viewers were there in that season? Round to one decimal place.d. How do the results obtained from the model in part (c) compare with the data displayed by the graph?e. Use a graphing utility to draw a scatter plot of the data and graph the quadratic function of best fit on the scatter plot. Can you see why projections based on the graph had the producers of American Idol looking for a shake-up? No shake-up was found and the show’s final season aired in 2016.
Step by Step Answer:
a b y 048x 2 617x 957 c According to the model in part b American Idol ...View the full answer


