

The graph of f(x) = ax 2 + bx + c is shown in the figure. Solve
Question:
The graph of f(x) = ax2 + bx + c is shown in the figure. Solve each inequality.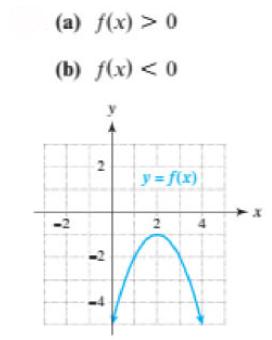
Fantastic news! We've Found the answer you've been seeking!
Step by Step Answer:
a b The inequality fx 0 is sati...View the full answer

Answered By
Joan Gakii
I'm a meticulous professional writer with over five years writing experience. My skill set includes
- Digital Content,
- Interpersonal Communication,
- Web Content and academic Writing,
- Proofreading,
- Editing,
- Project Management, and
- Public Relations.
7+ Reviews
12+ Question Solved
Related Book For 

College Algebra With Modeling And Visualization
ISBN: 9780134418049
6th Edition
Authors: Gary Rockswold
Question Posted:
