

The graph shows stopping distances for trucks at various speeds on dry roads and on wet roads.
Question:
The graph shows stopping distances for trucks at various speeds on dry roads and on wet roads. Use this information to solve Exercises 92–93.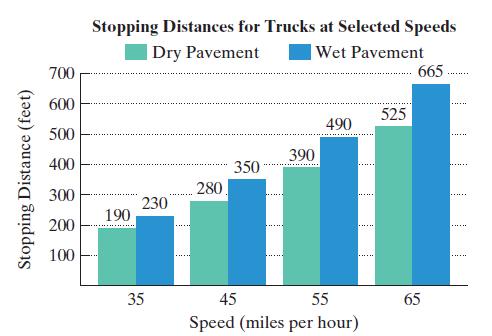 a. Use the statistical menu of your graphing utility and the quadratic regression program to obtain the quadratic function that models a truck’s stopping distance, f(x), in feet, on wet pavement traveling at x miles per hour. Round the x-coefficient and the constant term to one decimal place.b. Use the function from part (a) to determine speeds on wet pavement requiring stopping distances that exceed 446 feet.
Fantastic news! We've Found the answer you've been seeking!
Step by Step Answer:
a f x 01375x 2 07x 378 b 01375x 07x378 446 01375x 07x...View the full answer

Answered By
Ajay Negi
Hi, I've completed my degree in engineering (Information Technology) from an NIT. Currently working as a software engineer. Wish to impart quality education to the future generation.
2+ Reviews
10+ Question Solved
Related Book For 

Question Posted:
