

These exercises investigate the relationship between polynomial functions and their average rates of change. For example, the
Question:
These exercises investigate the relationship between polynomial functions and their average rates of change. For example, the average rate of change of f(x) = x2 from x to x + 0.001 for any x can be calculated and graphed as shown in the figures. The graph of f is a parabola, and the graph of its average rate of change is a line. Try to discover what this relation- ship is by completing the following.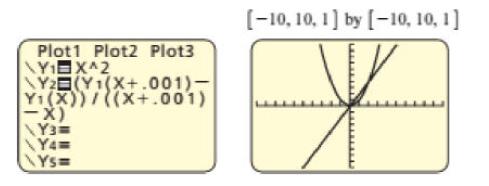
(a) Graph each function and its average rate of change from x to x + 0.001.
(b) Compare the graphs. How are turning points on the graph of a function related to its average rate of change?
(c) Generalize your results. Test your generalization.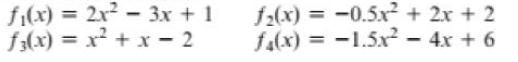
Fantastic news! We've Found the answer you've been seeking!
Step by Step Answer:
a See Figures 5ad b The graph of each quadratic function has ...View the full answer

Answered By
Caroline Kinuthia
Taking care of the smaller details in life has a larger impact in our general well being, and that is what i believe in. My name is Carol. Writing is my passion. To me, doing a task is one thing, and delivering results from the task is another thing. I am a perfectionist who always take things seriously and deliver to the best of my knowledge.
1933+ Reviews
4269+ Question Solved
Related Book For 

College Algebra With Modeling And Visualization
ISBN: 9780134418049
6th Edition
Authors: Gary Rockswold
Question Posted:
