

The atmospheric pressure (in millibars) at a given altitude (in meters) is shown in the table. (a)
Question:
The atmospheric pressure (in millibars) at a given altitude (in meters) is shown in the table.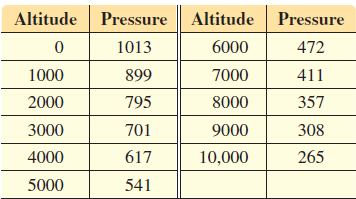
(a) Use a graphing calculator to make a scatter diagram of the data for atmospheric pressure P at altitude x.
(b) Would a linear or an exponential function fit the data better?
(c) The following function approximates the data. P(x) = 1013e-0.0001341x
Use a graphing calculator to graph P and the data on the same coordinate axes.
(d) Use P to predict the pressures at 1500 m and 11,000 m, and compare them to the actual values of 846 millibars and 227 millibars, respectively.
Fantastic news! We've Found the answer you've been seeking!
Step by Step Answer:
a b From the graph above we can see that the data are not linear but ex...View the full answer

Answered By
PALASH JHANWAR
I am a Chartered Accountant with AIR 45 in CA - IPCC. I am a Merit Holder ( B.Com ). The following is my educational details.
PLEASE ACCESS MY RESUME FROM THE FOLLOWING LINK: https://drive.google.com/file/d/1hYR1uch-ff6MRC_cDB07K6VqY9kQ3SFL/view?usp=sharing
3+ Reviews
10+ Question Solved
Related Book For 

College Algebra
ISBN: 978-0134697024
12th edition
Authors: Margaret L. Lial, John Hornsby, David I. Schneider, Callie Daniels
Question Posted:
