

The graph of a function is shown in the figure. Use the graph to find each
Question:
The graph of a function ƒ is shown in the figure. Use the graph to find each value.
ƒ-1(2)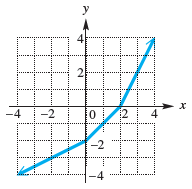
Fantastic news! We've Found the answer you've been seeking!
Step by Step Answer:
To find f 1 2 find the ...View the full answer

Answered By
Brown Arianne
Detail-oriented professional tutor with a solid 10 years of experience instilling confidence in high school and college students. Dedicated to empowering all students with constructive feedback and practical test-taking strategies. Effective educator and team player whether working in a school, university, or private provider setting. Active listener committed to helping students overcome academic challenges to reach personal goals.
2+ Reviews
10+ Question Solved
Related Book For 

College Algebra
ISBN: 978-0134697024
12th edition
Authors: Margaret L. Lial, John Hornsby, David I. Schneider, Callie Daniels
Question Posted:
