

The graph shows dollars (in billions) spent for general science and for space/other technologies in selected years.
Question:
The graph shows dollars (in billions) spent for general science and for space/other technologies in selected years.
G (x) represents the dollars spent for general science.
S (x) represents the dollars spent for space and other technologies.
T (x) represents the total expenditures for these two categories.
Science and Space Spending
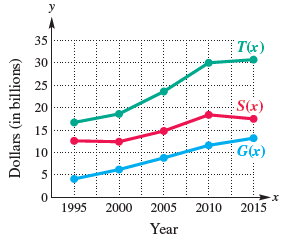
Estimate (T - S)(2000). What does this function represent?
Fantastic news! We've Found the answer you've been seeking!
Step by Step Answer:
T S 2000 T2000 S 2000 1...View the full answer

Answered By
OTIENO OBADO
I have a vast experience in teaching, mentoring and tutoring. I handle student concerns diligently and my academic background is undeniably aesthetic
3+ Reviews
10+ Question Solved
Related Book For 

College Algebra
ISBN: 978-0134697024
12th edition
Authors: Margaret L. Lial, John Hornsby, David I. Schneider, Callie Daniels
Question Posted:
