

The graph shows the daily megawatts of electricity used on a record-breaking summer day in Sacramento, California.
Question:
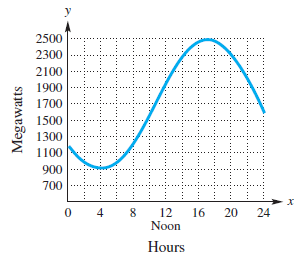
The graph shows the daily megawatts of electricity used on a record-breaking summer day in Sacramento, California.
(a) Is this the graph of a function?
(b) What is the domain?
(c) Estimate the number of megawatts used at 8 a.m.
(d) At what time was the most electricity used? the least electricity?
(e) Call this function ƒ. What is ƒ(12)? Interpret your answer.
(f) During what time intervals is usage increasing? decreasing?
Electricity Use
Fantastic news! We've Found the answer you've been seeking!
Step by Step Answer:
a Yes it is the graph of a function b 0 24 c When t 8 y 1200 from the grap...View the full answer

Answered By
NGOLUA RICHARD
WHEN I WAS IN HIGH SCHOOL I USED TO ADMIRE THE TEACHING STYLE OF MY HISTORY TEACHER. THIS WAS THE BEGGINING OF MY LOVE FOR THE TEACHING JOB. WHEN I WENT TO UNIVERSITY TO STUDY MY BACHELOR OF EDUCATION, I EXTENDED MY TEACHING CAREER TO ONLINE TUTORING. I HAVE SINCE THEN ADVANCED AND INCREASED EXPERIENCE IN ONLINE TUTORING. NOWADAYS, I CAN RESEARCH AND TYPE UP TO TWENTY PAGES OF AN ESSAY IN A SINGLE DAY.
0 Reviews
10+ Question Solved
Related Book For 

College Algebra
ISBN: 978-0134697024
12th edition
Authors: Margaret L. Lial, John Hornsby, David I. Schneider, Callie Daniels
Question Posted:
