

The graph shows the number of U.S. radio stations on the air, along with the graph of
Question:
The graph shows the number of U.S. radio stations on the air, along with the graph of a linear function that models the data.
U.S. Radio Stations
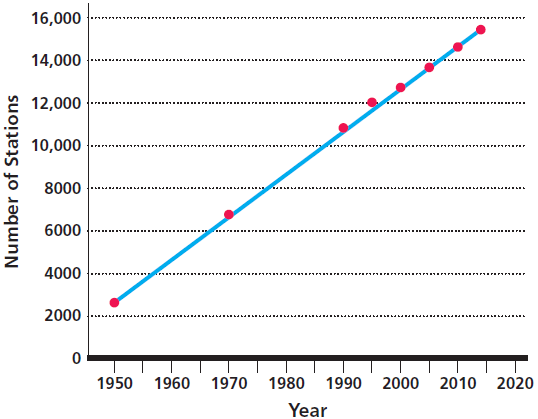
(a) An equation for a linear model, based on data from 1950–2014 (where x = 0 represents 1950, x = 10 represents 1960, and so on) is y = 200.02x + 2727.7. Determine the slope. What does the slope of this line represent? Why is the slope positive?
(b) Use the model in part (a) to predict the number of stations in 2018.
Fantastic news! We've Found the answer you've been seeking!
Step by Step Answer:
a From the equation the slope is 20002 This means th...View the full answer

Answered By
Branice Buyengo Ajevi
I have been teaching for the last 5 years which has strengthened my interaction with students of different level.
1+ Reviews
10+ Question Solved
Related Book For 

College Algebra
ISBN: 978-0134697024
12th edition
Authors: Margaret L. Lial, John Hornsby, David I. Schneider, Callie Daniels
Question Posted:
