

The diagram below shows the speedtime graph of part of a short journey made by a cyclist.
Question:
The diagram below shows the speed—time graph of part of a short journey made by a cyclist.
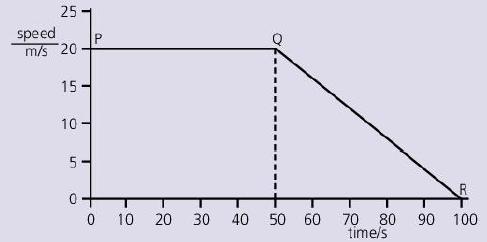
a. Which part of the graph shows when the cyclist is travelling at constant speed?
b. State what is happening during the rest of the journey shown in the graph.
c. i. Calculate the distance travelled during the first 50 s.
ii. Calculate the distance travelled between 50 s and 100 s.
iii. Calculate the total distance travelled.
iv. Calculate the average speed during the 100 s.
Fantastic news! We've Found the answer you've been seeking!
Step by Step Answer:
Part a Cyclist is travelling at constant speed from 0 to 50s Part b F...View the full answer

Answered By
Rabia Ahmed
Since the end of A levels I have been teaching to students of various classes. I had also done internship at SOS children's Villages where I had the experience of teaching and communicating with students who had suffered alot during their lifetime and had the difficulty in grasping the learning concept.
0 Reviews
10+ Question Solved
Related Book For 

Question Posted:
