

The cash flows in Table P6.39 represent the potential annual savings associated with two different types of
Question:
The cash flows in Table P6.39 represent the potential annual savings associated with two different types of production processes. each of which requires an investment of $40,000. Assume an interest rate of 12%.
(a) Determine the equivalent annual savings for each process.
(b) Determine the hourly savings for each process if it will be in operation of 3.000 hours per year.
(c) Which process should be selected?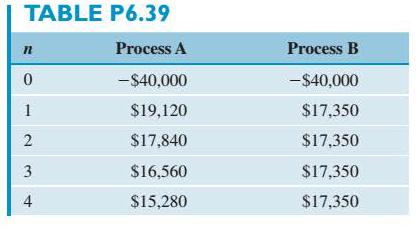
Fantastic news! We've Found the answer you've been seeking!
Step by Step Answer:
a b c Process A is a b...View the full answer

Answered By
GERALD KAMAU
non-plagiarism work, timely work and A++ work
6+ Reviews
11+ Question Solved
Related Book For 
Question Posted:
