A linear dynamic model of the -subsystem of a grid connected voltage source converter (VSC) using a
Question:
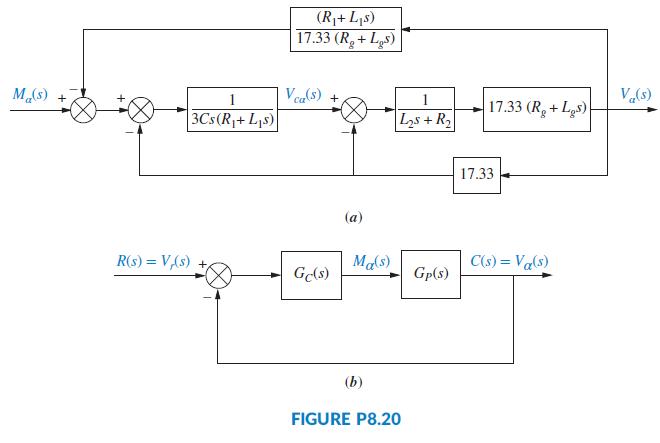
A linear dynamic model of the α-subsystem of a grid connected voltage source converter (VSC) using a Y-Y transformer is shown in Figure P8.20 (a) (Mahmood, 2012).
a. Find the transfer function GP(s) = Vα(s)/Mα(s).
b. If GP(s) is the plant in Figure P8.20(b) and GC(s) = K, use MATLAB to plot the root locus. On a closeup of the locus (from -300 to 0 on the real axis and from -50 to 5000 on the imaginary axis), find K and the coordinates of the dominant poles, which correspond to ζ = 0.012. Plot the output response, c(t) = vα(t), at that value of the gain when a step input, r(t)= vr (t)= 208 u(t) volts, is applied at t = 0. Mark on the time response graph, c(t), all relevant characteristics, such as the percent overshoot, peak time, rise time, settling time, and final steady-state value.
Step by Step Answer:

This question has not been answered yet.
You can Ask your question!