Consider the following annual model of the death rate (per million population) due to coronary heart disease
Question:
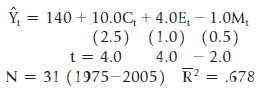
Where:
Ct = per capita cigarette consumption (pounds of tobacco) in year t
Et = per capita consumption of edible saturated fats (pounds of butter, margarine, and lard) in year t
Mt = per capita consumption of meat (pounds) in year t
a. Create and test appropriate hypotheses at the 10-percent level. What, if anything, seems to be wrong with the estimated coefficient of M?
b. The most likely cause of a coefficient that is significant in the unexpected direction is omitted variable bias. Which of the following variables could possibly be an omitted variable that is causing N M€™s unexpected sign? Explain.
Bt = per capita consumption of hard liquor (gallons) in year t
Ft = the average fat content (percentage) of the meat that was consumed in year t
Wt = per capita consumption of wine and beer (gallons) in year t
Rt = per capita number of miles run in year t
Ht = per capita open-heart surgeries in year t
Ot = per capita amount of oat bran eaten in year t
c. If you had to choose a variable not listed in part b to add to the equation, what would it be? Explain your answer.
Step by Step Answer:
a Coefficient C E M Hypoth Sign tvalue 40 40 20 t C 1314 reject reject do not 10 onesided reject wit...View the full answer