

Energy prices and capital formation: United States, 19481978. To test the hypothesis that a rise in the
Question:
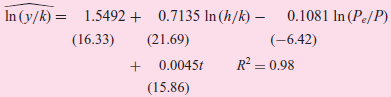
Where
y = real output in the private business sector
k = a measure of the flow of capital services
h = person hours in the private business sector
Pe = producer price index for fuel and related products
P = private business sector price deflator
t = time
The numbers in parentheses are t statistics.
a. Do the results support the author€™s hypothesis?
b. Between 1972 and 1977 the relative price of energy, (Pe/P), increased by 60 percent. From the estimated regression, what is the loss in productivity?
c. After allowing for the changes in (h/k) and (Pe/P), what has been the trend rate of growth of productivity over the sample period?
d. How would you interpret the coefficient value of 0.7135?
e. Does the fact that each estimated partial slope coefficient is individually statistically significant (why?) mean we can reject the hypothesis that R2 = 0? Why or why not?
Step by Step Answer:
a Yes The fuel price index is negative and statistically significant at the 1 level b The output ...View the full answer


