

Since R 2 as a measure of goodness of fit is not particularly well suited for the
Question:
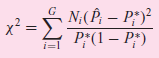
where Ni = number of observations in the ith cell
PÌ‚i = actual probability of the event occurring ( = ni/Ni)
Pˆ—i= estimated probability
G = number of cells (i.e., the number of levels at which Xi is measured, e.g., 10 in Table 15.4)
It can be shown that, for large samples, χ2 is distributed according to the χ2 distribution with (G ˆ’ k) df, where k is the number of parameters in the estimating model (k < G).
Apply the preceding χ2 test to regression (15.7.1) and comment on the resulting goodness of fit and compare it with the reported R2 value.
DistributionThe word "distribution" has several meanings in the financial world, most of them pertaining to the payment of assets from a fund, account, or individual security to an investor or beneficiary. Retirement account distributions are among the most...
Fantastic news! We've Found the answer you've been seeking!
Step by Step Answer:
The 2 test statistic here is 23449 whose p v...View the full answer

Answered By
Mercy Kangai
I provide creative and detailed administrative, web search, academic writing, data entry, Personal assistant, Content writing, Translation, Academic writing, editing and proofreading services. I excel at working under tight deadlines with strict expectations. I possess the self-discipline and time management skills necessary to have served as an academic writer for the past seven years. I can bring value to your business and help solve your administrative assistant issues. I have extensive experience in marketing and small business management.
27+ Reviews
83+ Question Solved
Related Book For 

Question Posted:
