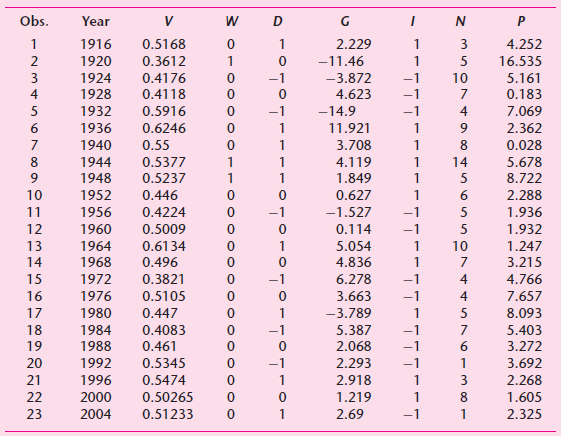
The following table 0gives data on quadrennial presidential elections in the United States from 1916 to 2004.*
Question:
a. Using the data given in the following table, develop a suitable model to predict the Democratic share of the two-party presidential vote.
b. How would you use this model to predict the outcome of a presidential election?
c. Chatterjee et al. suggested considering the following model as a trial model to predict presidential elections:
V = β0 + β1 I + β2D + β3W + β4(GI) + β5P + β6N + u
Estimate this model and comment on the results in relation to the results of the model you have chosen.
Fantastic news! We've Found the answer you've been seeking!
Step by Step Answer:
Related Book For 

Question Posted:


