Your friend is just finishing a study of attendance at Los Angeles Laker regular-season home basketball games
Question:
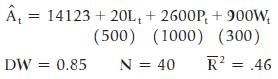
Where:
At = the attendance at game t
Lt = the winning percentage (games won divided by games played) of the Lakers before game t
Pt = the winning percentage before game t of the Lakers€™ opponent in that game
Wt = a dummy variable equal to 1 if game t was on Friday, Saturday, or Sunday, 0 otherwise
a. Test for serial correlation using the Durbin€“Watson test at the 5-percent level.
b. Make and test appropriate hypotheses about the slope coefficients at the 1-percent level.
c. Compare the size and significance of the estimated coefficient of L with that for P. Is this difference surprising? Is L an irrelevant variable? Explain your answer.
d. If serial correlation exists, would you expect it to be pure or impure serial correlation? Why?
e. Your friend omitted the first game of the year from the sample because the first game is always a sellout and because neither team had a winning percentage yet. Was this a good decision?
Step by Step Answer:
a As weve mentioned we prefer a onesided DurbinWatson d test so with K 3 and N 40 the 5 critical val...View the full answer