

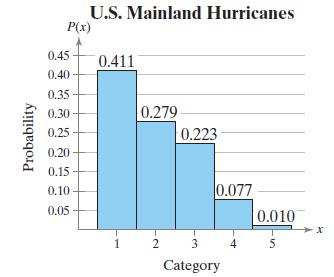
The histogram shows the distribution of hurricanes that have hit the U.S. mainland from 1851 through 2015
Question:
The histogram shows the distribution of hurricanes that have hit the U.S. mainland from 1851 through 2015 by Saffir-Simpson category, where 1 is the weakest level and 5 is the strongest level.
(a) Find the mean, variance, and standard deviation of the probability distribution,
(b) Interpret the results.
Fantastic news! We've Found the answer you've been seeking!
Step by Step Answer:
a For Mean For Variance Standard Devia...View the full answer

Answered By
MORINKE KUDAOS
I am an educator that has the necessary abilities and expertise owing to extensive interaction with students. I present answers to a variety of problems with step-by-step explanations, a well-thought-out strategy, and an easily understood breakdown. My objective is to teach students more easy methods and comprehension so that they may attain more success.
0 Reviews
10+ Question Solved
Related Book For 

Elementary Statistics Picturing The World
ISBN: 9780134683416
7th Edition
Authors: Ron Larson, Betsy Farber
Question Posted:
