

The pass completion percentages of 10 college football quarterbacks for their freshman and sophomore seasons are shown
Question:
The pass completion percentages of 10 college football quarterbacks for their freshman and sophomore seasons are shown in the table below. At α = 0.10, is there enough evidence to support the claim that the pass completion percentages have changed?
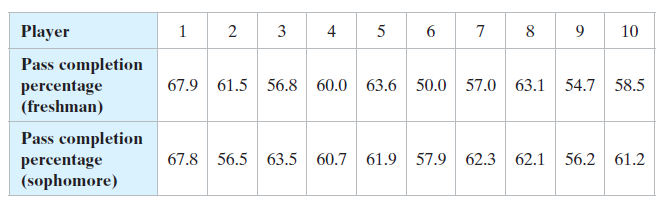
(a) Identify the claim and state H0 and Ha,
(b) Find the critical value(s) and identify the rejection region(s),
(c) Calculate d and sd,
(d) Find the standardized test statistic t,
(e) Decide whether to reject or fail to reject the null hypothesis, and
(f ) interpret the decision in the context of the original claim. Assume the samples are random and dependent, and the populations are normally distributed.
Fantastic news! We've Found the answer you've been seeking!
Step by Step Answer:
a The claim is contestants times have changed H 0 d 0 H a d 0 claim ...View the full answer

Answered By
John Kimutai
I seek to use my competencies gained through on the job experience and skills learned in training to carry out tasks to the satisfaction of users. I have a keen interest in always delivering excellent work
11+ Reviews
24+ Question Solved
Related Book For 

Elementary Statistics Picturing The World
ISBN: 9780134683416
7th Edition
Authors: Ron Larson, Betsy Farber
Question Posted:
