

The responses of 1254 voters to a survey about the way the media conducted themselves in the
Question:
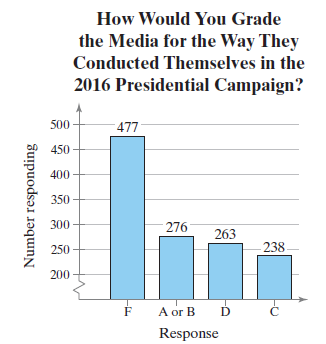
The responses of 1254 voters to a survey about the way the media conducted themselves in the 2016 presidential campaign are shown in the Pareto chart. Find the probability of each event.
(a) Randomly selecting a person from the sample who did not give the media an A or a B.
(b) Randomly selecting a person from the sample who gave the media a grade better than a D.
(c) Randomly selecting a person from the sample who gave the media a D or an F.
(d) Randomly selecting a person from the sample who gave the media a C or a D.
Fantastic news! We've Found the answer you've been seeking!
Step by Step Answer:
a b c d Pn...View the full answer

Answered By
Milan Mondal
I am milan mondal have done my Msc in physics (special astrophysics and relativity) from the University of burdwan and Bed in physical science from the same University.
From 2018 I am working as pgt physics teacher in kendriya vidyalaya no2 kharagpur ,west bengal. And also I am doing advanced physics expert in chegg.com .also I teach Bsc physics .
I love to teach physics and acience.
If you give me a chance I will give my best to you.
4+ Reviews
10+ Question Solved
Related Book For 

Elementary Statistics Picturing The World
ISBN: 9780134683416
7th Edition
Authors: Ron Larson, Betsy Farber
Question Posted:
