

The table shows the ages of students in a freshman orientation course. (a) Construct a probability distribution.
Question:
The table shows the ages of students in a freshman orientation course.
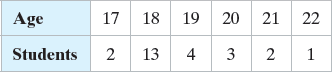
(a) Construct a probability distribution.
(b) Graph the probability distribution using a histogram and describe its shape.
(c) Find the mean, variance, and standard deviation of the probability distribution and interpret the results.
(d) Find the probability that a randomly selected student is less than 20 years old.
DistributionThe word "distribution" has several meanings in the financial world, most of them pertaining to the payment of assets from a fund, account, or individual security to an investor or beneficiary. Retirement account distributions are among the most...
Fantastic news! We've Found the answer you've been seeking!
Step by Step Answer:
a b c The mean is 187 so the average student in the course i...View the full answer

Answered By
Albert Kinara
i am an expert research writer having worked with various online platform for a long time. i also work as a lecturer in business in several universities and college part time and assure you well researched and articulate papers. i have written excellent academic papers for over 5 year and have an almost similar experience experting many clients in different units. bachelor of commerce (finance)
masters in strategic management
phd finance
26+ Reviews
48+ Question Solved
Related Book For 

Elementary Statistics Picturing The World
ISBN: 9780134683416
7th Edition
Authors: Ron Larson, Betsy Farber
Question Posted:
