

The table shows the numbers of male and female students in the U.S. who received bachelors degrees
Question:
The table shows the numbers of male and female students in the U.S. who received bachelor’s degrees in business in a recent year. A student is selected at random. Find the probability of each event.
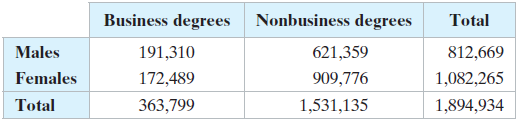
(a) The student is male or received a business degree.
(b) The student is female or received a nonbusiness degree.
(c) The student is not female or received a nonbusiness degree.
Fantastic news! We've Found the answer you've been seeking!
Step by Step Answer:
Let A male B business ...View the full answer

Answered By
Nyron Beeput
I am an active educator and professional tutor with substantial experience in Biology and General Science. The past two years I have been tutoring online intensively with high school and college students. I have been teaching for four years and this experience has helped me to hone skills such as patience, dedication and flexibility. I work at the pace of my students and ensure that they understand.
My method of using real life examples that my students can relate to has helped them grasp concepts more readily. I also help students learn how to apply their knowledge and they appreciate that very much.
1+ Reviews
10+ Question Solved
Related Book For 

Elementary Statistics Picturing The World
ISBN: 9780134683416
7th Edition
Authors: Ron Larson, Betsy Farber
Question Posted:
