

To compare the mean number of days spent waiting to see a family doctor for two large
Question:
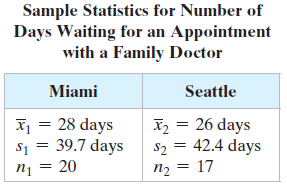
To compare the mean number of days spent waiting to see a family doctor for two large cities, you randomly select several people in each city who have had an appointment with a family doctor. The results are shown at the left. Construct a 90% confidence interval for the difference in mean number of days spent waiting to see a family doctor for the two cities.
When the sampling distribution for x̅1 - x̅2 is approximated by a t-distribution and the populations have equal variances, you can construct a confidence interval for μ1 - μ2, as shown below.
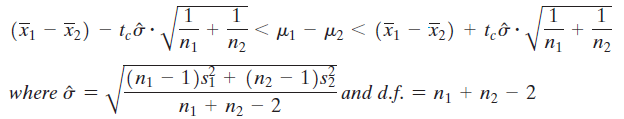
construct the indicated confidence interval for μ1 - μ2. Assume the populations are approximately normal with equal variances.
DistributionThe word "distribution" has several meanings in the financial world, most of them pertaining to the payment of assets from a fund, account, or individual security to an investor or beneficiary. Retirement account distributions are among the most...
Step by Step Answer:
6 1s n 1s n n 2 ...View the full answer


Elementary Statistics Picturing The World
ISBN: 9780134683416
7th Edition
Authors: Ron Larson, Betsy Farber
