

The vt graph for the motion of a car as it moves along a straight road is
Question:
The v–t graph for the motion of a car as it moves along a straight road is shown. Draw the s–t and a–t graphs. Also determine the average speed and the distance traveled for the 15-s time interval. When t = 0, s = 0.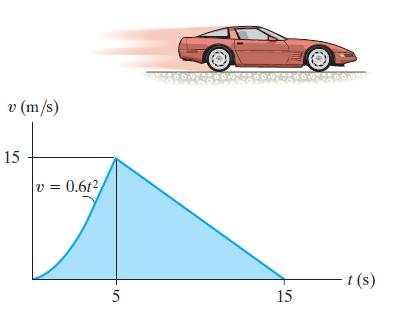
Fantastic news! We've Found the answer you've been seeking!
Step by Step Answer:
st Graph The st function can be determined by integrating ds v dt For 0 t 5 s v 06t 2 Us...View the full answer

Answered By
JAPHETH KOGEI
Hi there. I'm here to assist you to score the highest marks on your assignments and homework. My areas of specialisation are:
Auditing, Financial Accounting, Macroeconomics, Monetary-economics, Business-administration, Advanced-accounting, Corporate Finance, Professional-accounting-ethics, Corporate governance, Financial-risk-analysis, Financial-budgeting, Corporate-social-responsibility, Statistics, Business management, logic, Critical thinking,
So, I look forward to helping you solve your academic problem.
I enjoy teaching and tutoring university and high school students. During my free time, I also read books on motivation, leadership, comedy, emotional intelligence, critical thinking, nature, human nature, innovation, persuasion, performance, negotiations, goals, power, time management, wealth, debates, sales, and finance. Additionally, I am a panellist on an FM radio program on Sunday mornings where we discuss current affairs.
I travel three times a year either to the USA, Europe and around Africa.
As a university student in the USA, I enjoyed interacting with people from different cultures and ethnic groups. Together with friends, we travelled widely in the USA and in Europe (UK, France, Denmark, Germany, Turkey, etc).
So, I look forward to tutoring you. I believe that it will be exciting to meet them.
2+ Reviews
10+ Question Solved
Related Book For 
Engineering Mechanics Statics & Dynamics
ISBN: 9780134895154
15th Edition
Authors: Russell C. Hibbeler
Question Posted:
