

(a) Make a line chart for JetBlue?s revenue, using the years as X-axis labels. (b) Click on...
Question:
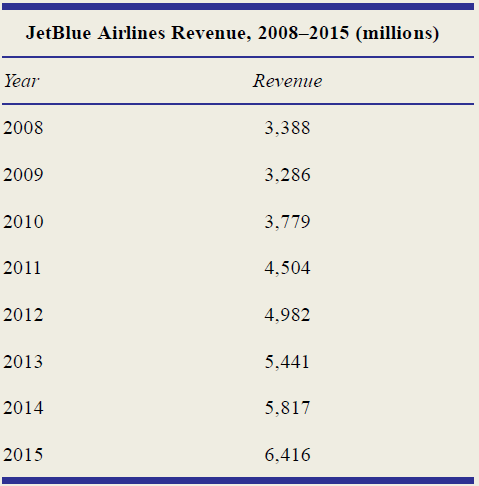
(a) Make a line chart for JetBlue?s revenue, using the years as X-axis labels.
(b) Click on the line and fit a linear trend to the data (slope, intercept, R2).
(c) What does the R2 tell you? The slope?
(d) Make predictions (forecasts) for the next three years. Excel uses xt = 1, 2, ? for the time periods (thpeage 502 year is just a label). Optional challenge: (e*) Use the int: JetBlue?s published annual Form 10-K reports. Data are foernet to look up JetBlue?s annual revenue for 2016?2018. How accurate were your predictions?
Fantastic news! We've Found the answer you've been seeking!
Step by Step Answer:
a See graph in part b below b The fitted trend is y t 25955 46804 x ...View the full answer

Answered By
ZIPPORAH KISIO LUNGI
I have worked on several other sites for more than five years, and I always handle clients work with due diligence and professionalism. Am versed with adequate experience in the fields mentioned above in which have delivered quality papers in research, thesis, essays, blog articles, and so forth.
I have gained extensive experience in assisting students to acquire top grades in biological, business and IT papers. Notwithstanding that, I have 7+ years of experience in corporate world software design and development.
194+ Reviews
341+ Question Solved
Related Book For 

Essential Statistics In Business And Economics
ISBN: 9781260239508
3rd Edition
Authors: David Doane, Lori Seward
Question Posted:
