

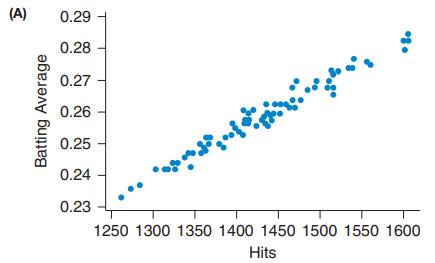
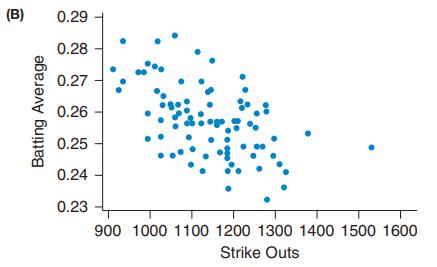
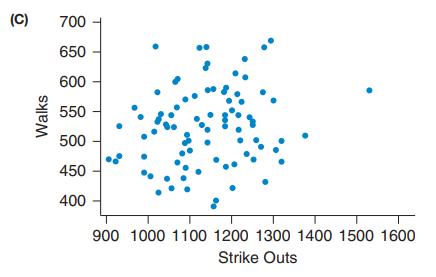
Match each of the following correlations with the corresponding graph. -0.51 _________ 0.98 _________ 0.18 _________ (A)
Question:
Match each of the following correlations with the corresponding graph.
-0.51 _________
0.98 _________
0.18 _________
Fantastic news! We've Found the answer you've been seeking!
Step by Step Answer:
Since it has a stronger positive associat...View the full answer

Answered By
Muhammad Mahtab
everyone looks that their work be perfect. I have more than a five year experience as a lecture in reputable institution, national and international. I provide perfect solution in marketing, case study, finance problems, blog writing, article writing, business plans, strategic management, human resource, operation management, power point presentation and lot of clients need. Here is right mentor who help clients in their multi-disciplinary needs.
3+ Reviews
14+ Question Solved
Related Book For 

Essential Statistics
ISBN: 9780134134406
2nd Edition
Authors: Robert Gould, Colleen N. Ryan, Rebecca Wong
Question Posted:
