

People were asked whether they thought global warming is happening. The graph shows the results of two
Question:
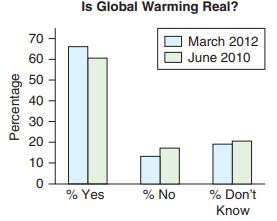
People were asked whether they thought global warming is happening. The graph shows the results of two surveys, one done in 2010 and the other done in 2012 (Leiserowitz et al.). Yes means they believe that global warming is happening and No means they do not believe that. What does the graph tell us about changes in opinions about global warming? Explain.
Fantastic news! We've Found the answer you've been seeking!
Step by Step Answer:
In 2012 more peo...View the full answer

Answered By
Benish Ahmad
I'm a professional software engineer. I'm lectutrer at GCUF and I have 3 years of teaching experience. I'm looking forward to getting mostly computer science work including:
Programming fundamentals
Object oriented programming
Data structures
object oriented design and analysis
Database system
Computer networks
Discrete mathematics
Web application
I am expert in different computer languages such as C++, java, JavaScript, Sql, CSS, Python and C#. I'm also have excellent knowledge of essay writing and research. I have worked in other Freelancing website such as Fiverr and Upwork. Now I have finally decided to join the SolutionInn platform to continue with my explicit work of helping dear clients and students to achieve their academic dreams. I deliver plagiarism free work and exceptional projects on time. I am capable of working under high pressure.
2+ Reviews
10+ Question Solved
Related Book For 

Essential Statistics
ISBN: 9780134134406
2nd Edition
Authors: Robert Gould, Colleen N. Ryan, Rebecca Wong
Question Posted:
