

The figure shows information about the ages and heights of several children. Why would it not make
Question:
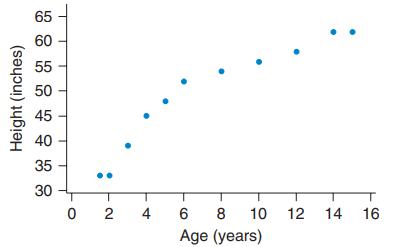
The figure shows information about the ages and heights of several children. Why would it not make sense to find the correlation or to perform linear regression with this data set? Explain.
Fantastic news! We've Found the answer you've been seeking!
Step by Step Answer:
Linear regressio...View the full answer

Answered By
Muhammad Riaz
Experience:
Tutoring experience of more than 20 years enabled me to understand the class-problems and to identify the individuals needs. I can comprehend and analyze the students struggle to guide them in a better, effective and efficient way, ultimately leading them to a prosperous future.
0 Reviews
10+ Question Solved
Related Book For 

Essential Statistics
ISBN: 9780134134406
2nd Edition
Authors: Robert Gould, Colleen N. Ryan, Rebecca Wong
Question Posted:
