

The figure, which is from data taken from the Ventura County Star, shows a histogram of house
Question:
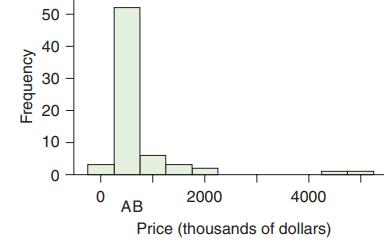
The figure, which is from data taken from the Ventura County Star, shows a histogram of house prices in Thousand Oaks, California, in 2009. The location of the mean and median are marked with letters. Which is the location of the mean, A or B? Explain why the mean and median are not the same.
Fantastic news! We've Found the answer you've been seeking!
Step by Step Answer:
The mean is at B and the medi...View the full answer

Answered By
Utsab mitra
I have the expertise to deliver these subjects to college and higher-level students. The services would involve only solving assignments, homework help, and others.
I have experience in delivering these subjects for the last 6 years on a freelancing basis in different companies around the globe. I am CMA certified and CGMA UK. I have professional experience of 18 years in the industry involved in the manufacturing company and IT implementation experience of over 12 years.
I have delivered this help to students effortlessly, which is essential to give the students a good grade in their studies.
2+ Reviews
10+ Question Solved
Related Book For 

Essential Statistics
ISBN: 9780134134406
2nd Edition
Authors: Robert Gould, Colleen N. Ryan, Rebecca Wong
Question Posted:
