

The scatterplot shows the age and number of hours of sleep last night for some students. Do
Question:
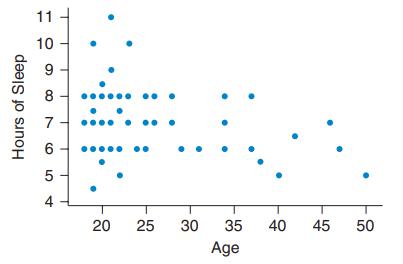
The scatterplot shows the age and number of hours of sleep “last night” for some students. Do you think the trend is slightly positive or slightly negative? What does that mean?
Fantastic news! We've Found the answer you've been seeking!
Step by Step Answer:
There is a slight negative t...View the full answer

Answered By
Amos Kiprotich
I am a wild researcher and I guarantee you a well written paper that is plagiarism free. I am a good time manager and hence you are assured that your paper will always be delivered a head of time. My services are cheap and the prices include a series of revisions, free referencing and formatting.
15+ Reviews
21+ Question Solved
Related Book For 

Essential Statistics
ISBN: 9780134134406
2nd Edition
Authors: Robert Gould, Colleen N. Ryan, Rebecca Wong
Question Posted:
