

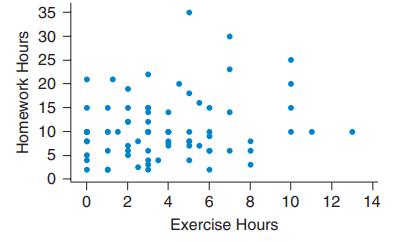
The scatterplot shows the number of hours of exercise per week and the number of hours of
Question:
The scatterplot shows the number of hours of exercise per week and the number of hours of homework per week for some students. Explain what it shows.
Fantastic news! We've Found the answer you've been seeking!
Step by Step Answer:
The number of hours of exe...View the full answer

Answered By
Pushpinder Singh
Currently, I am PhD scholar with Indian Statistical problem, working in applied statistics and real life data problems. I have done several projects in Statistics especially Time Series data analysis, Regression Techniques.
I am Master in Statistics from Indian Institute of Technology, Kanpur.
I have been teaching students for various University entrance exams and passing grades in Graduation and Post-Graduation.I have expertise in solving problems in Statistics for more than 2 years now.I am a subject expert in Statistics with Assignmentpedia.com.
3+ Reviews
10+ Question Solved
Related Book For 

Essential Statistics
ISBN: 9780134134406
2nd Edition
Authors: Robert Gould, Colleen N. Ryan, Rebecca Wong
Question Posted:
