

The scatterplot shows the number of hours of work per week and the number of hours of
Question:
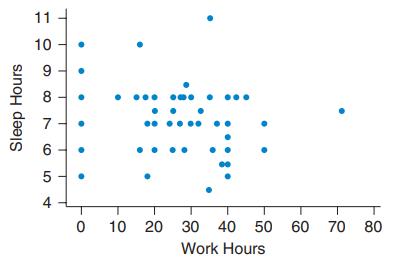
The scatterplot shows the number of hours of work per week and the number of hours of sleep per night for some college students. Does the graph show a strong increasing trend, a strong decreasing trend, or very little trend? Explain.
Fantastic news! We've Found the answer you've been seeking!
Step by Step Answer:
There is very little trend ...View the full answer

Answered By
Ashish Bhalla
I have 12 years work experience as Professor for Accounting, Finance and Business related subjects also working as Online Tutor from last 8 years with highly decentralized organizations. I had obtained a B.Com, M.Com, MBA (Finance & Marketing). My research interest areas are Banking Problem & Investment Management. I am highly articulate and effective communicator with excellent team-building and interpersonal skills; work well with individuals at all levels.
17+ Reviews
46+ Question Solved
Related Book For 

Essential Statistics
ISBN: 9780134134406
2nd Edition
Authors: Robert Gould, Colleen N. Ryan, Rebecca Wong
Question Posted:
