

The table shows the ethnic distribution of judges in California in 2006 and 2011, Explain why you
Question:
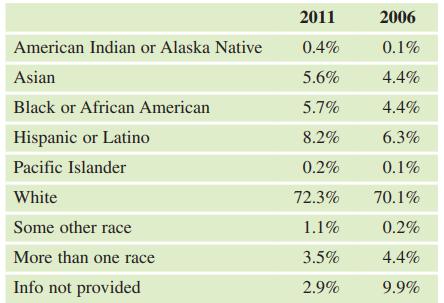
The table shows the ethnic distribution of judges in California in 2006 and 2011,
Explain why you should not perform a chisquare test of homogeneity on this data set.
Fantastic news! We've Found the answer you've been seeking!
Step by Step Answer:
The data are percentages ...View the full answer

Answered By
Mugdha Sisodiya
My self Mugdha Sisodiya from Chhattisgarh India. I have completed my Bachelors degree in 2015 and My Master in Commerce degree in 2016. I am having expertise in Management, Cost and Finance Accounts. Further I have completed my Chartered Accountant and working as a Professional.
Since 2012 I am providing home tutions.
2+ Reviews
10+ Question Solved
Related Book For 

Essential Statistics
ISBN: 9780134134406
2nd Edition
Authors: Robert Gould, Colleen N. Ryan, Rebecca Wong
Question Posted:
