

This table shows the distribution of winning times in the Kentucky Derby (a horse race) over 87
Question:
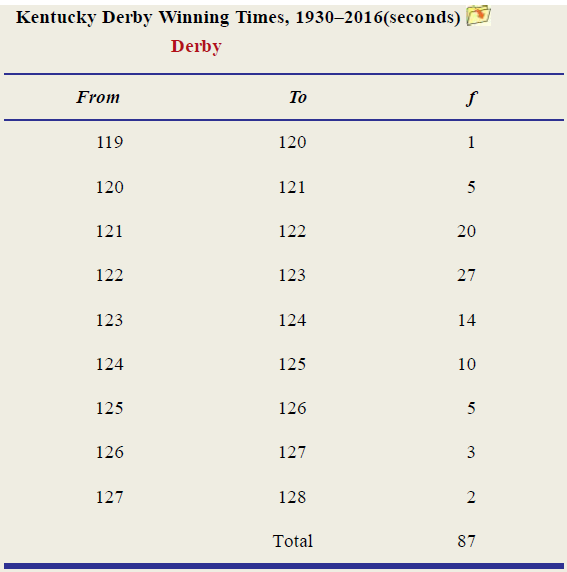
This table shows the distribution of winning times in the Kentucky Derby (a horse race) over 87 years.
(a) From the grouped data, calculate the mean. Show your calculations clearly in a worksheet.
(b) What additional information would you have gained by having the raw data?
(c) Do you think it likely that the distribution of times within each interval might not be uniform? Why would that matter?
The word "distribution" has several meanings in the financial world, most of them pertaining to the payment of assets from a fund, account, or individual security to an investor or beneficiary. Retirement account distributions are among the most...
Fantastic news! We've Found the answer you've been seeking!
Step by Step Answer:
a From To frequency f midpoint m fm fm 119 120 1 1195 1195 1181 120 ...View the full answer

Answered By
Moses mwangi
With prior writing experience, be sure that I will give a great grade, If not an A+, it will be something close to this. My reviews speaks it all, Try me!!
78+ Reviews
157+ Question Solved
Related Book For 
Essential Statistics In Business And Economics
ISBN: 9781260239508
3rd Edition
Authors: David Doane, Lori Seward
Question Posted:
