

Use the histograms to compare the times spent commuting for community college students who drive to school
Question:
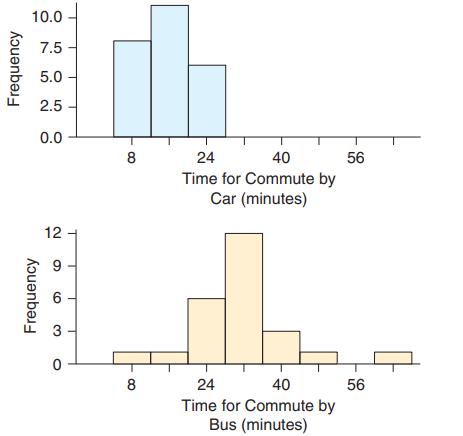
Use the histograms to compare the times spent commuting for community college students who drive to school in a car with the times spent by those who take the bus. Which group typically has the longer commute time? Which group has the more variable commute time?
Fantastic news! We've Found the answer you've been seeking!
Step by Step Answer:
Riding the bu...View the full answer

Answered By
Carly Cimino
As a tutor, my focus is to help communicate and break down difficult concepts in a way that allows students greater accessibility and comprehension to their course material. I love helping others develop a sense of personal confidence and curiosity, and I'm looking forward to the chance to interact and work with you professionally and better your academic grades.
12+ Reviews
21+ Question Solved
Related Book For 

Essential Statistics
ISBN: 9780134134406
2nd Edition
Authors: Robert Gould, Colleen N. Ryan, Rebecca Wong
Question Posted:
