

Examine the graph below. It shows the global iPhone phone sales by year in millions of units
Question:
Examine the graph below. It shows the global iPhone phone sales by year in millions of units sold.
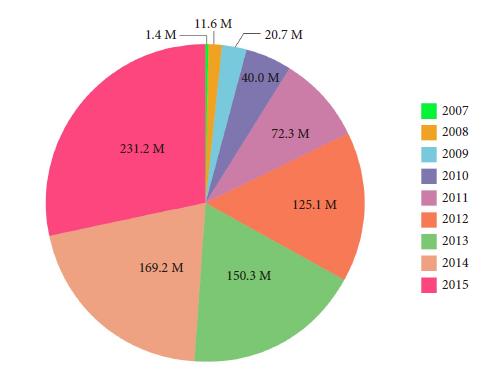
a. Write nine ordered pairs with the first coordinate being the year number and the second being the units sold in millions as shown here. 1,400,000 units sold in 2007 would be represented by (1, 1.4) since 2007 is year 1 of the data listed. To save data entry time, you can use 1.4 rather than 1,400,000 as long as you remember that your y-coordinates will always be in millions when using and reporting data and findings.
b. Construct a scatter plot.
c. Find the equation of the regression line. Round the slope and the y-intercept to the nearest hundredth.
d. What is the slope of the linear regression line?
e. What are the units of the slope expressed as a rate?
f. Find the correlation coefficient to the nearest hundredth. Describe the correlation.
g. In January 2016, financial advisors estimated that the global sales for iPhones in 2016 would have dropped to 218.0m. Use your regression line to predict the sales in that year. Is your answer interpolation or extrapolation? Explain.
h. Do a search to find the actual global sales of iPhones in 2016. How do the financial advisors’ estimate, regression line prediction, and the actual sales compare? Explain.
Step by Step Answer:

This question has not been answered yet.
You can Ask your question!


Financial Algebra Advanced Algebra With Financial Applications
ISBN: 9781337271790
2nd Edition
Authors: Robert Gerver, Richard J. Sgroi
