

Over the past 4 years, Reggie noticed that as the price of a slice of pizza increased,
Question:
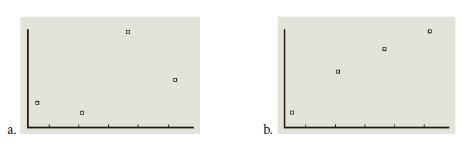
Over the past 4 years, Reggie noticed that as the price of a slice of pizza increased, her college tuition also increased. She found the correlation coefficient was r 50.49.
a. Which of the following scatter plots most accurately displays Reggie’s data? Explain.
b. Would the price of a slice of pizza be labeled as the explanatory variable and the tuition the response variable? Explain.
Fantastic news! We've Found the answer you've been seeking!
Step by Step Answer:
a Answer b Explanation The scatter plot should show a positive linear relationship between the price ...View the full answer

Answered By
User l_917591
As a Business Management graduate from Moi University, I had the opportunity to work as a tutor for undergraduate students in the same field. This experience allowed me to apply the theoretical knowledge I had gained in a practical setting, while also honing my teaching and communication skills.
As a tutor, I was responsible for conducting tutorial sessions, grading assignments and exams, and providing feedback and support to my students. I also assisted with the preparation of course materials and collaborated with other tutors and professors to ensure consistency in teaching and assessment.
0 Reviews
10+ Question Solved
Related Book For 

Financial Algebra Advanced Algebra With Financial Applications
ISBN: 9781337271790
2nd Edition
Authors: Robert Gerver, Richard J. Sgroi
Question Posted:
