

The stock chart shows the 3-day and 10-day SMA for 20 consecutive trading days. Identify the crossovers
Question:
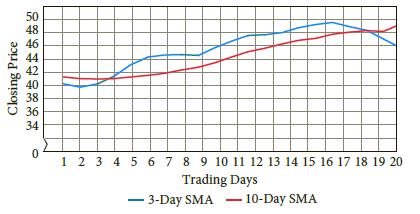
The stock chart shows the 3-day and 10-day SMA for 20 consecutive trading days. Identify the crossovers and discuss the implications.
Fantastic news! We've Found the answer you've been seeking!
Step by Step Answer:
ANSWER Based on the provided stock chart we can observe that there are several instances of crossove...View the full answer

Answered By
Aketch Cindy Sunday
I am a certified tutor with over two years of experience tutoring . I have a passion for helping students learn and grow, and I firmly believe that every student has the potential to be successful. I have a wide range of experience working with students of all ages and abilities, and I am confident that I can help students succeed in school.
I have experience working with students who have a wide range of abilities. I have also worked with gifted and talented students, and I am familiar with a variety of enrichment and acceleration strategies.
I am a patient and supportive tutor who is dedicated to helping my students reach their full potential. Thank you for your time and consideration.
0 Reviews
10+ Question Solved
Related Book For 

Financial Algebra Advanced Algebra With Financial Applications
ISBN: 9781337271790
2nd Edition
Authors: Robert Gerver, Richard J. Sgroi
Question Posted:
