

When sold as a new car in the 1950s, the price of a specific classic car was
Question:
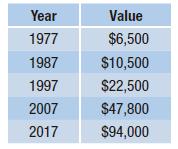
When sold as a new car in the 1950s, the price of a specific classic car was $13,074. It depreciated in value over the next few years. Then, in 1977, something interesting began to happen, as seen in this table of values.
a. Construct a scatter plot for the data. Let 1977 be Year 1, 1987 be Year 11, 1997 be Year 21, and so on. What do you notice about the trend?
b. Find an exponential regression equation that models this situation. Round the numbers to the nearest hundredth.
c. What kind of a rate has been used? What is the value of that rate to the nearest tenth of a percent?
Fantastic news! We've Found the answer you've been seeking!
Step by Step Answer:
a To construct a scatter plot for this data we would plot the year on the xaxis and the value on t...View the full answer

Answered By
Vikas Rathour
I have been tutoring for over five years, and I have experience with students of all ages and levels. I have a degree in Education and I am currently working on my Master's degree in Education. I am patient and adaptable, and I am confident that I can help any student improve their grades and confidence in any subject.
0 Reviews
10+ Question Solved
Related Book For 

Financial Algebra Advanced Algebra With Financial Applications
ISBN: 9781337271790
2nd Edition
Authors: Robert Gerver, Richard J. Sgroi
Question Posted:
