

Assume that you recently graduated with a major in finance. You just landed a job as a
Question:
Assume that you recently graduated with a major in finance. You just landed a job as a financial planner with Merrill Finch Inc., a large financial services corporation. Your first assignment is to invest $100,000 for a client. Because the funds are to be invested in a business at the end of 1 year, you have been instructed to plan for a 1-year holding period. Further, your boss has restricted you to the investment alternatives in the following table, shown with their probabilities and associated outcomes. (For now, disregard the items at the bottom of the data; you will fill in the blanks later.)
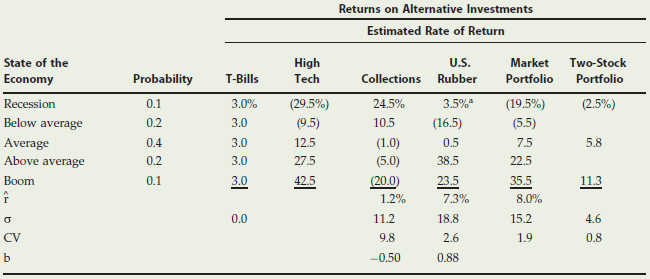
aThe estimated returns of U.S. Rubber do not always move in the same direction as the overall economy. For example, when the economy is below average, consumers purchase fewer tires than they would if the economy was stronger. However, if the economy is in a flat-out recession, a large number of consumers who were planning to purchase a new car may choose to wait and instead purchase new tires for the car they currently own. Under these circumstances, we would expect U.S. Rubber’s stock price to be higher if there is a recession than if the economy is just below average.
Merrill Finch’s economic forecasting staff has developed probability estimates for the state of the economy, and its security analysts developed a sophisticated computer program to estimate the rate of return on each alternative under each state of the economy. High Tech Inc. is an electronics firm; Collections Inc. collects past-due debts; and U.S. Rubber manufactures tires and various other rubber and plastics products. Merrill Finch also maintains a “market portfolio†that owns a market-weighted fraction of all publicly traded stocks; you can invest in that portfolio and thus obtain average stock market results. Given the situation described, answer the following questions:
a. 1. Why is the T-bill’s return independent of the state of the economy? Do T-bills promise a completely risk-free return? Explain.
2. Why are High Tech’s returns expected to move with the economy, whereas Collections’s are expected to move counter to the economy?
b. Calculate the expected rate of return on each alternative, and fill in the blanks on the row for r^ in the previous table.
c. You should recognize that basing a decision solely on expected returns is appropriate only for risk neutral individuals. Because your client, like most people, is risk-averse, the riskiness of each alternative is an important aspect of the decision. One possible measure of risk is the standard deviation of returns.
1. Calculate this value for each alternative and fill in the blank on the row for σ in the table.
2. What type of risk is measured by the standard deviation?
3. Draw a graph that shows roughly the shape of the probability distributions for High Tech, U.S. Rubber, and T-bills.
d. Suppose you suddenly remembered that the coefficient of variation (CV) is generally regarded as being a better measure of stand-alone risk than the standard deviation when the alternatives being considered have widely differing expected returns. Calculate the missing CVs, and fill in the blanks on the row for CV in the table. Does the CV produce the same risk rankings as the standard deviation? Explain.
e. Suppose you created a two-stock portfolio by investing $50,000 in High Tech and $50,000 in Collections.
1. Calculate the expected return r^ p , the standard deviation σp , and the coefficient of variation (CVP)
for this portfolio, and fill in the appropriate blanks in the table.
2. How does the riskiness of this two-stock portfolio compare with the riskiness of the individual stocks if they were held in isolation?
f. Suppose an investor starts with a portfolio consisting of one randomly selected stock.
1. What would happen to the riskiness and to the expected return of the portfolio as more randomly selected stocks were added to the portfolio?
2. What is the implication for investors? Draw a graph of the two portfolios to illustrate your answer.
g. 1. Should the effects of a portfolio impact the way investors think about the riskiness of individual stocks?
2. If you decided to hold a one-stock portfolio (and consequently were exposed to more risk than diversified investors), could you expect to be compensated for all of your risk; that is, could you earn a risk premium on the part of your risk that you could have eliminated by diversifying?
h. The expected rates of return and the beta coefficients of the alternatives supplied by an independent analyst are as follows:
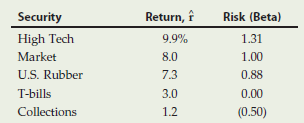
1. What is a beta coefficient, and how are betas used in risk analysis?
2. Do the expected returns appear to be related to each alternative’s market risk?
3. Is it possible to choose among the alternatives on the basis of the information developed thus far? Use the data given at the start of the problem to construct a graph that shows how the T-bill’s, High Tech’s, and the market’s beta coefficients are calculated. Then discuss what betas measure and how they are used in risk analysis.
i. The yield curve is currently flat; that is, long-term Treasury bonds also have a 3.0% yield. Consequently, Merrill Finch assumes that the risk-free rate is 3.0%.
1. Write out the security market line (SML) equation; use it to calculate the required rate of return on each alternative; and graph the relationship between the expected and required rates of return.
2. How do the expected rates of return compare with the required rates of return?
3. Does the fact that Collections has an expected return that is less than the T-bill rate make any sense? Explain.
4. What would be the market risk and the required return of a 50–50 portfolio of High Tech and Collections? Of High Tech and U.S. Rubber?
j. 1. Suppose investors raised their inflation expectations by 3 percentage points over current estimates as reflected in the 3.0% risk-free rate. What effect would higher inflation have on the SML and on the returns required on high- and low-risk securities?
2. Suppose instead that investors’ risk aversion increased enough to cause the market risk premium to increase by 3 percentage points. (Inflation remains constant.) What effect would this have on the SML and on returns of high- and low-risk securities?
Stocks or shares are generally equity instruments that provide the largest source of raising funds in any public or private listed company's. The instruments are issued on a stock exchange from where a large number of general public who are willing... Expected Return
The expected return is the profit or loss an investor anticipates on an investment that has known or anticipated rates of return (RoR). It is calculated by multiplying potential outcomes by the chances of them occurring and then totaling these...
Step by Step Answer:
a 1 The 30 Tbill return does not depend on the state of the economy because the Treasury must and will redeem the bills at par regardless of the state of the economy The Tbills are risk free in the de...View the full answer


Fundamentals of Financial Management
ISBN: 978-1305635937
Concise 9th Edition
Authors: Eugene F. Brigham
