

The following is an excerpt from McDonalds Corporations 2015 Management Discussion and Analysis. The MD&A, which is
Question:
The following is an excerpt from McDonald’s Corporation’s 2015 Management Discussion and Analysis. The MD&A, which is included in the Form 10-K annual report to the SEC, provides insight into the financial statements, with a focus on explaining changes from one period to the next.
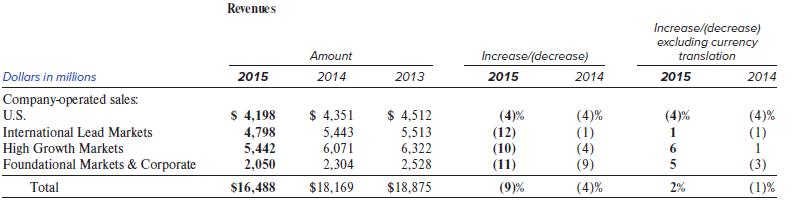
REVENUES
The Company’s revenues consist of sales by Company-operated restaurants and fees from restaurants operated by franchisees. Revenues from conventional franchised restaurants include rent and royalties based on a percent of sales, minimum rent payments and initial fees. Revenues from franchised restaurants that are licensed to foreign affiliates and developmental licensees include a royalty based on a percent of sales, and generally include initial fees.
The Company is accelerating the pace of refranchising to optimize its restaurant ownership mix, generate more stable and predictable revenue and cash flow streams, and operate with a less resource-intensive structure. The shift to a greater percentage of franchised restaurants negatively impacts consolidated revenues as Company-operated sales are replaced by franchised sales, where the Company receives rent and/or royalty revenue based on a percentage of sales.
In 2015, constant currency revenue growth was driven by positive comparable sales and the benefit from expansion. In 2014, constant currency revenue was flat compared to the prior year, reflecting the impact of negative comparable sales, partially offset by expansion.
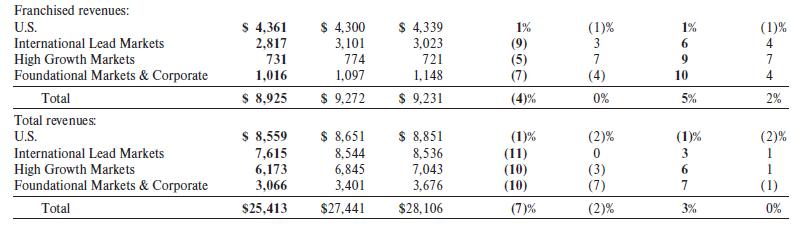
FRANCHISED MARGINS
Franchised margin dollars represent revenues from franchised restaurants less the Company’s occupancy costs (rent and depreciation) associated with those sites. Franchised margin dollars represented about 70% of the combined restaurant margins in 2015, 2014 and 2013.
In 2015, franchised margin dollars decreased $297 million or 4% (increased 4% in constant currencies). The constant currency increase was due to positive comparable sales performance, expansion and refranchising. In 2014, franchised margin dollars decreased $32 million or 0% (increased 1% in constant currencies), reflecting a benefit from expansion and refranchising, offset by negative comparable sales performance.
In connection with the Company’s long-term financial targets, the Company plans to refranchise about 4,000 restaurants for the four-year period ending 2018. While this refranchising activity may have a dilutive effect on the franchised margin percent, it typically results in higher franchised margin dollars.
Franchised margins
• U.S.: In 2015, the decrease in the franchised margin percent was due to higher occupancy costs. In 2014, the decrease was primarily due to negative comparable sales and higher occupancy costs.
• International Lead Markets: In 2015, the franchised margin percent reflected the benefit from positive comparable sales performance and the negative impact from higher lease expense and refranchising. In 2014, the decrease was due to weaker results in Germany and the negative impact from refranchising, primarily in Germany and Australia, partly offset by positive results in the U.K.
• High Growth Markets: In 2015, the decrease in the franchised margin percent was primarily due to the impact from refranchising. In 2014, the decrease was primarily due to negative comparable sales across the segment.
The franchised margin percent in Foundational Markets & Corporate is higher relative to the other segments due to a larger proportion of developmental licensed and/or affiliated restaurants where the Company receives royalty income with no corresponding occupancy costs.
COMPANY-OPERATED MARGINS
Company-operated margin dollars represent sales by Company-operated restaurants less the operating costs of these restaurants. In 2015, Company-operated margin dollars decreased $370 million or 13% (1% in constant currencies). In 2014, Company-operated margin dollars decreased $415 million or 13% (11% in constant currencies), reflecting weak results across all segments.
Company-operated margins
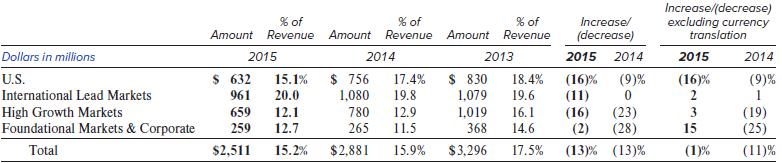
• U.S.: In 2015, the decrease in the Company-operated margin percent was primarily due to the incremental investment in wages and benefits for eligible Company-operated restaurant employees, effective July 1, 2015, designed to improve restaurant performance and enhance our employment proposition. In 2014, the decrease was due to the impact of negative comparable guest counts and higher commodity and labor costs, partly offset by higher average check.
• International Lead Markets: In 2015, the increase in the Company-operated margin percent was due to higher comparable sales and the result of refranchising efforts, partly offset by higher labor and occupancy costs. In 2014, the increase was primarily due to positive results in France, partly offset by weaker results in Germany.
• High Growth Markets: In 2015, the decrease in the Company-operated margin percent was primarily due to the negative impact from currency and inflationary pressures in Russia, and higher labor and occupancy costs across the segment. This was partly offset by the benefit from recovery in China from the 2014 supplier issue. In 2014, the decrease was primarily due to the negative impact of the supplier issue in China and weaker results in Russia. Source: McDonald’s Corporation 2015 Form 10-K.
The following is McDonald’s statement of comprehensive income, also from its 2015 Form 10-K.
Consolidated Statement of Comprehensive Income
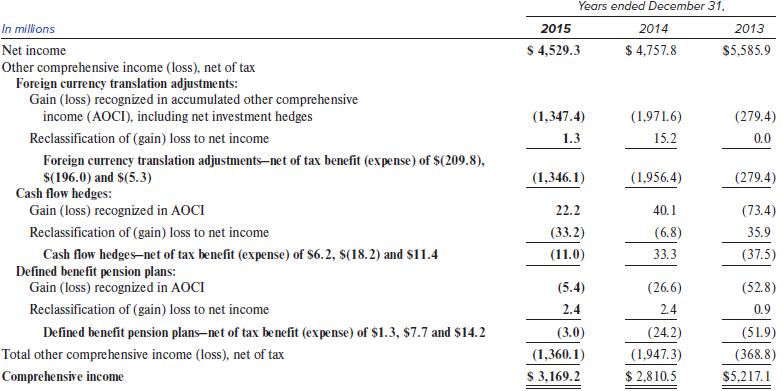
McDonald’s has two sources of revenue: sales at company-owned stores and rent and royalty revenues from franchised stores. Because McDonald’s has a substantial number of foreign units—only about a third of the company’s revenues are from its U.S. operations—fluctuations in exchange rates significantly affect the company’s results, as reported in U.S. dollars.
Required:
1. Examine the Statement of Comprehensive Income. How did exchange rates fluctuate in 2015, 2014, and 2013? (The phrase “exchange rates” here refers to a basket of exchange rates of the foreign countries in which McDonald’s operates, versus the U.S. dollar. Obviously, not every exchange rate will have behaved the same way. This question is asking about a weighted-average exchange rate against the U.S. dollar.)
2. Decompose the change in revenue into the effects of (a) growth in the revenue as reported in the local currency and (b) the effect of changes in exchange rates. You should have a total of 16 (2 × 4 × 2) such analyses, one for each combination of the following:
• Revenue types (company-owned, franchised)
• Market types (U.S., international lead markets, high growth markets, foundational markets/corporate)
• Year (2015 vs. 2014, 2014 vs. 2013)
Both of the components [(a) and (b)] in each of the 16 analyses should be stated in U.S. dollars and they should sum to the total change in revenues as reported in U.S. dollars for that particular combination of revenue type, market type, and year. For example, the two components of the analysis for company-owned stores in the international lead markets for 2015 vs. 2014 should sum to −$645 million ($4,798 million minus $5,443 million).
3. Discuss the results in Requirement 2 and relate them to foreign currency translation rules. Include in your response a discussion of whether your results would have been similar or different if McDonald’s had used the temporal method.
4. Using the information from the MD&A, determine the margin percentages (margin dollars divided by revenues) broken out in the following ways:
• By revenue type (company-owned versus franchised stores).
• By market (U.S., international lead markets, high-growth markets, foundational markets/corporate).
• By year (2015, 2014, 2013).
Each percentage you report should relate to one of each of the three categories listed, for a total of 2 × 4 × 3 = 24 percentages.
5. Determine 16 (2 × 4 × 2) “constant currency” margin percentages broken out in the following ways:
• By revenue type (company-owned versus franchised stores).
• By market (U.S., international lead markets, high-growth markets, foundational markets & corporate).
• By year (2015, 2014).
To find the “constant currency” margin percentage: Use the McDonald’s disclosure to determine what the 2014 revenue and margin dollars would have been for each of the eight combinations of revenue type and market had exchange rates not changed from 2013 to 2014, holding all else constant. Then compute the margin percentages for 2014 using the revenues and margin dollars you computed. Similarly, determine what the 2015 revenue and margin dollars would have been for each combination of revenue type and market had exchange rates not changed from 2014 to 2015, holding all else constant. Then compute the margin percentages for 2015 using the revenues and margin dollars you computed.
Note that in doing this analysis, you should look only at pairs of years, not all three at once. In other words, when looking at the 2015 constant currency margin percentage, you assume the exchange rate was the same as in 2014, not that it was still the same as in 2013.
6. Discuss the results in Requirements 4 and 5 and relate them to foreign currency translation rules. Include in your response a discussion of whether your results would have been similar or different if McDonald’s had used the temporal method.
Step by Step Answer:
Requirement 1 First we see McDonalds is using the current rate method because the translation adjustment flows through OCIFurther there is a loss related to foreign currency translation included in OC...View the full answer


Financial Reporting And Analysis
ISBN: 9781260247848
8th Edition
Authors: Lawrence Revsine, Daniel Collins, Bruce Johnson, Fred Mittelstaedt, Leonard Soffer
