

The following table provides ROA and ROCE for Best Buy, a retailer of consumer electronics. The adjusted
Question:
The following table provides ROA and ROCE for Best Buy, a retailer of consumer electronics.
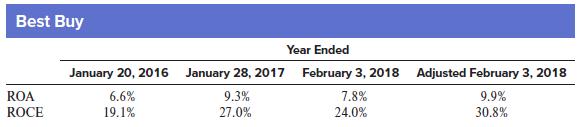
The adjusted February 3, 2018, amounts exclude the one-time income statement effect of the Tax Cuts and Jobs Act.
Required:
1. In analyzing Best Buy, is it most appropriate to use the actual results for the year ended February 3, 2018, or the adjusted results?
2. How did Best Buy’s performance change over the period shown?
3. What is the most likely reason the change in ROCE was so much greater than the change in ROA?
Fantastic news! We've Found the answer you've been seeking!
Step by Step Answer:
Requirement 1 It is more appropriate to use the adjusted results for the year ended February 3 2018N...View the full answer

Answered By
Bhartendu Goyal
Professional, Experienced, and Expert tutor who will provide speedy and to-the-point solutions. I have been teaching students for 5 years now in different subjects and it's truly been one of the most rewarding experiences of my life. I have also done one-to-one tutoring with 100+ students and help them achieve great subject knowledge. I have expertise in computer subjects like C++, C, Java, and Python programming and other computer Science related fields. Many of my student's parents message me that your lessons improved their children's grades and this is the best only thing you want as a tea...
2+ Reviews
10+ Question Solved
Related Book For 
Financial Reporting And Analysis
ISBN: 9781260247848
8th Edition
Authors: Lawrence Revsine, Daniel Collins, Bruce Johnson, Fred Mittelstaedt, Leonard Soffer
Question Posted:
